Example PD – Advanced data loading with pandas and ROOT
Aims
Instructions
Pandas is an open source, BSD-licensed library providing high-performance, easy-to-use data structures and data analysis tools for the Python programming language:
It provides a DataFrame class, which is a useful tool to organise
structured data:
from remu import binning
from remu import plotting
import numpy as np
import pandas as pd
pd.set_option('display.max_rows', 10)

px = np.random.randn(1000)*20
py = np.random.randn(1000)*20
pz = np.random.randn(1000)*20
df = pd.DataFrame({'px': px, 'py': py, 'pz': pz})
print(df)
            px         py         pz
0    -2.840325  22.108657  -0.516603
1     1.021440  41.311321   9.110285
2    -2.311842   7.761168  34.076248
3    31.893287 -12.497031  -9.125932
4    12.025659   3.006832 -18.585591
..         ...        ...        ...
995  -3.413603  21.201968 -21.732508
996  30.549099  19.142792  30.115672
997   5.267751  20.139826  11.095047
998  15.030364  -7.931964   4.888165
999  -8.671663  17.492177  21.862662

[1000 rows x 3 columns]
ReMU supports DataFrame objects as inputs for all
fill methods:
with open("muon-binning.yml", 'r') as f:
muon_binning = yaml.full_load(f)
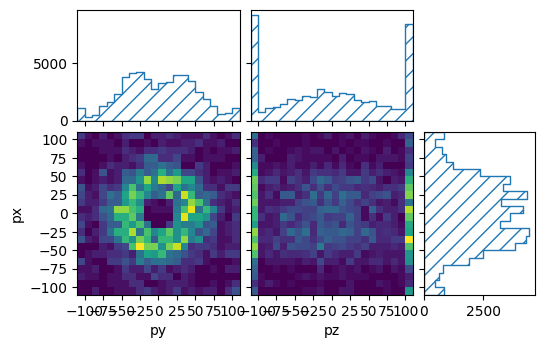
muon_binning.fill(df)
pltr = plotting.get_plotter(muon_binning, ['py','pz'], ['px'])
pltr.plot_values()
pltr.savefig("pandas.png")
This way, ReMU supports the same input file formats as the pandas library, e.g. CSV, JSON, HDF5, SQL, etc..
Using the uproot library, pandas can also be used to load ROOT files:
https://github.com/scikit-hep/uproot5
The ROOT framework is the de-facto standard for data analysis in high energy particle physics:
Uproot does not need the actual ROOT framework to be installed to work. It
can convert a flat ROOT TTree directly into a usable pandas
DataFrame:
import uproot

flat_tree = uproot.open("Zmumu.root")['events']
print(flat_tree.keys())
['Type', 'Run', 'Event', 'E1', 'px1', 'py1', 'pz1', 'pt1', 'eta1', 'phi1', 'Q1', 'E2', 'px2', 'py2', 'pz2', 'pt2', 'eta2', 'phi2', 'Q2', 'M']
df = flat_tree.arrays(library="pd")
print(df)
     Type     Run      Event          E1        px1  ...      pt2      eta2      phi2  Q2          M
0      GT  148031   10507008   82.201866 -41.195288  ...  38.8311 -1.051390 -0.440873  -1  82.462692
1      TT  148031   10507008   62.344929  35.118050  ...  44.7322 -1.217690  2.741260   1  83.626204
2      GT  148031   10507008   62.344929  35.118050  ...  44.7322 -1.217690  2.741260   1  83.308465
3      GG  148031   10507008   60.621875  34.144437  ...  44.7322 -1.217690  2.741260   1  82.149373
4      GT  148031  105238546   41.826389  22.783582  ...  21.8913  1.444340 -2.707650  -1  90.469123
...   ...     ...        ...         ...        ...  ...      ...       ...       ...  ..        ...
2299   GG  148029   99768888   32.701650  19.054651  ...  22.8145 -0.645971 -2.404430  -1  60.047138
2300   GT  148029   99991333  168.780121 -68.041915  ...  32.3997 -1.570440  0.037027   1  96.125376
2301   TT  148029   99991333   81.270136  32.377492  ...  72.8781 -1.482700 -2.775240  -1  95.965480
2302   GT  148029   99991333   81.270136  32.377492  ...  72.8781 -1.482700 -2.775240  -1  96.495944
2303   GG  148029   99991333   81.566217  32.485394  ...  72.8781 -1.482700 -2.775240  -1  96.656728

[2304 rows x 20 columns]
muon_binning.reset()
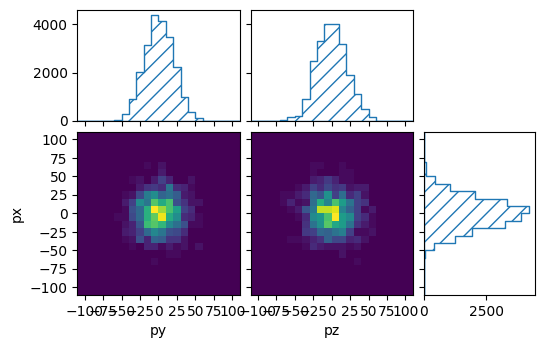
muon_binning.fill(df, rename={'px1': 'px', 'py1': 'py', 'pz1': 'pz'})
pltr = plotting.get_plotter(muon_binning, ['py','pz'], ['px'])
pltr.plot_values()
pltr.savefig("flat_muons.png")
ReMU expects exactly one row per event. If the root file is not flat, but has a more complicated structure, it must be converted first. For example, let us take a look at a file where each event has varying numbers of reconstructed particles:
structured_tree = uproot.open("HZZ.root")['events']
print(structured_tree.keys())
['NJet', 'Jet_Px', 'Jet_Py', 'Jet_Pz', 'Jet_E', 'Jet_btag', 'Jet_ID', 'NMuon', 'Muon_Px', 'Muon_Py', 'Muon_Pz', 'Muon_E', 'Muon_Charge', 'Muon_Iso', 'NElectron', 'Electron_Px', 'Electron_Py', 'Electron_Pz', 'Electron_E', 'Electron_Charge', 'Electron_Iso', 'NPhoton', 'Photon_Px', 'Photon_Py', 'Photon_Pz', 'Photon_E', 'Photon_Iso', 'MET_px', 'MET_py', 'MChadronicBottom_px', 'MChadronicBottom_py', 'MChadronicBottom_pz', 'MCleptonicBottom_px', 'MCleptonicBottom_py', 'MCleptonicBottom_pz', 'MChadronicWDecayQuark_px', 'MChadronicWDecayQuark_py', 'MChadronicWDecayQuark_pz', 'MChadronicWDecayQuarkBar_px', 'MChadronicWDecayQuarkBar_py', 'MChadronicWDecayQuarkBar_pz', 'MClepton_px', 'MClepton_py', 'MClepton_pz', 'MCleptonPDGid', 'MCneutrino_px', 'MCneutrino_py', 'MCneutrino_pz', 'NPrimaryVertices', 'triggerIsoMu24', 'EventWeight']
df = structured_tree.arrays(["NMuon", "Muon_Px", "Muon_Py", "Muon_Pz"], library='pd')
print(df)
      NMuon  ...                                   Muon_Pz
0         2  ...  [-8.16079330444336, -11.307581901550293]
1         1  ...                      [20.199968338012695]
2         2  ...   [11.168285369873047, 36.96519088745117]
3         2  ...   [403.84844970703125, 335.0942077636719]
4         2  ...  [-89.69573211669922, 20.115053176879883]
...     ...  ...                                       ...
2416      1  ...                      [61.715789794921875]
2417      1  ...                       [160.8179168701172]
2418      1  ...                      [-52.66374969482422]
2419      1  ...                       [162.1763153076172]
2420      1  ...                       [54.71943664550781]

[2421 rows x 4 columns]
This kind of data frame with “lists” as cell elements can be inconvenient to handle. But we can flatten it using the power of the awkward:
import awkward as ak

arr = structured_tree.arrays(["NMuon", "Muon_Px", "Muon_Py", "Muon_Pz"])
df = ak.to_dataframe(arr)
print(df)
                NMuon    Muon_Px    Muon_Py     Muon_Pz
entry subentry
0     0             2 -52.899456 -11.654672   -8.160793
      1             2  37.737782   0.693474  -11.307582
1     0             1  -0.816459 -24.404259   20.199968
2     0             2  48.987831 -21.723139   11.168285
      1             2   0.827567  29.800508   36.965191
...               ...        ...        ...         ...
2416  0             1 -39.285824 -14.607491   61.715790
2417  0             1  35.067146 -14.150043  160.817917
2418  0             1 -29.756786 -15.303859  -52.663750
2419  0             1   1.141870  63.609570  162.176315
2420  0             1  23.913206 -35.665077   54.719437

[3825 rows x 4 columns]
This double-index structure is still not suitable as input for ReMU, though. We can select only the first muon in each event, to get the required “one event per row” structure:
idx = pd.IndexSlice
df = df.loc[idx[:,0], :]
print(df)
                NMuon    Muon_Px    Muon_Py     Muon_Pz
entry subentry
0     0             2 -52.899456 -11.654672   -8.160793
1     0             1  -0.816459 -24.404259   20.199968
2     0             2  48.987831 -21.723139   11.168285
3     0             2  22.088331 -85.835464  403.848450
4     0             2  45.171322  67.248787  -89.695732
...               ...        ...        ...         ...
2416  0             1 -39.285824 -14.607491   61.715790
2417  0             1  35.067146 -14.150043  160.817917
2418  0             1 -29.756786 -15.303859  -52.663750
2419  0             1   1.141870  63.609570  162.176315
2420  0             1  23.913206 -35.665077   54.719437

[2362 rows x 4 columns]
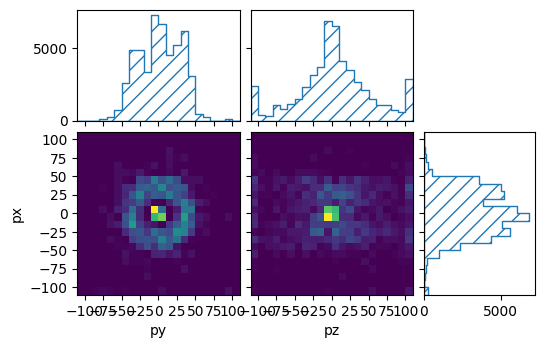
muon_binning.reset()
muon_binning.fill(df, rename={'Muon_Px': 'px', 'Muon_Py': 'py', 'Muon_Pz': 'pz'})

pltr = plotting.get_plotter(muon_binning, ['py','pz'], ['px'])
pltr.plot_values()
pltr.savefig("sliced_muons.png")